
U.S. Tariffs Policy : Global Economic Impacts Under Biden and Modi Leadership
U.S. Tariffs Policy : Global Economic Impacts Under Biden and Modi Leadership
Introduction
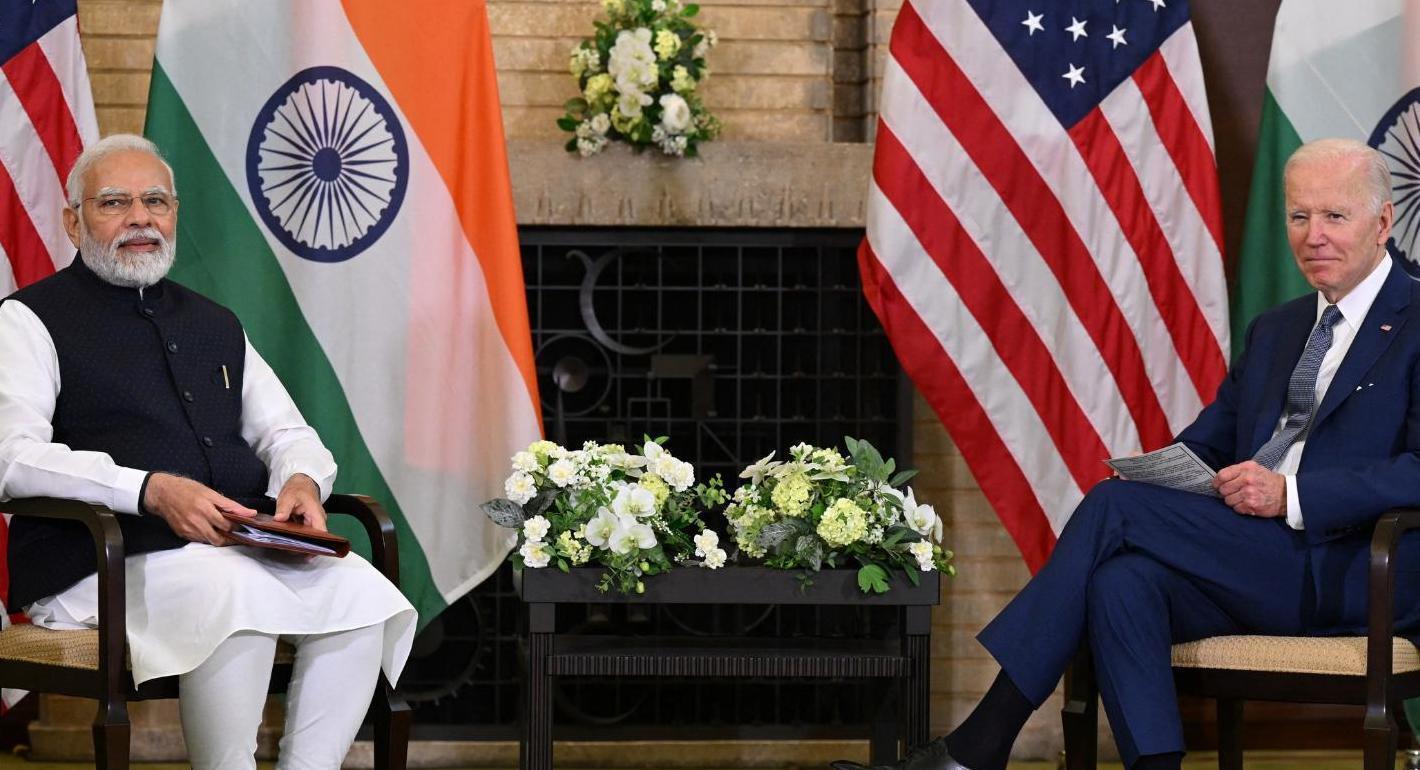
Under President Joe Biden’s administration, the United States has continued to utilize tariffs as a strategic economic tool, building upon policies initiated during President Donald Trump’s tenure. These trade measures, particularly targeting Chinese imports, have created significant ripple effects across the global economy. Meanwhile, under Prime Minister Narendra Modi’s leadership, India has navigated these turbulent trade waters while positioning itself as an alternative manufacturing hub. This analysis examines the multifaceted impacts of U.S. tariffs on international trade, education systems, financial markets, and everyday citizens in both nations.
U.S. Tariff Policies and Global Chain Reactions
The Biden administration has strategically maintained and expanded the tariff framework established during the Trump presidency, implementing a nuanced approach to international trade that combines economic protectionism with geopolitical strategy. This continuation and evolution of U.S. tariff policy has created significant reverberations throughout the global economy, demonstrating how unilateral trade actions can trigger multilateral consequences.
Expansion of Existing Tariff Regimes
President Biden has notably preserved several key Trump-era tariff measures while adding new dimensions to U.S. trade policy:
- Sustained China Tariffs:
- Maintained 25% tariffs on approximately $370 billion worth of Chinese imports
- These cover approximately 18,000 product categories including:
- Industrial machinery and components (34% of total tariffed goods)
- Consumer electronics (22%)
- Automotive parts (15%)
- Annual tariff revenue has averaged $85 billion since 2021
- Technology Export Controls:
- Implemented sweeping restrictions on semiconductor technology transfers
- Banned export of advanced chip-making equipment to China
- Restricted Chinese access to U.S. cloud computing services with AI applications
- These measures have effectively blocked China’s access to sub-14nm chip manufacturing technology
- Alliance-Centric Exemptions:
- Granted tariff relief for strategic partners through:
- The U.S.-EU Trade and Technology Council agreements
- Indo-Pacific Economic Framework (IPEF) provisions
- Bilateral arrangements with Japan and South Korea
- Created a two-tiered tariff system favoring allied nations
- Granted tariff relief for strategic partners through:
The Tariff Domino Effect in Action
The implementation of these policies has triggered a cascading series of retaliatory measures across global markets:
- China’s Comprehensive Response:
- Imposed counter-tariffs on $110 billion of U.S. exports, targeting:
- Agricultural products (soybeans, pork, almonds)
- Energy exports (LNG, crude oil)
- Automotive products
- Implemented non-tariff barriers including:
- Slowed customs clearance for U.S. goods
- Increased regulatory scrutiny of American companies
- Strategic rare earth export controls
- Imposed counter-tariffs on $110 billion of U.S. exports, targeting:
- European Union’s Measured Retaliation:
- Levied $4 billion in counter-tariffs on iconic U.S. products:
- 25% on Harley-Davidson motorcycles
- 50% on Kentucky bourbon
- 10% on Levi’s jeans
- Implemented the Carbon Border Adjustment Mechanism (CBAM) affecting U.S. steel exports
- Levied $4 billion in counter-tariffs on iconic U.S. products:
- India’s Strategic Countermeasures:
- Increased duties on 28 U.S. product categories including:
- Apples (duty raised from 50% to 75%)
- Almonds (from ₹42/kg to ₹120/kg)
- Walnuts (from 100% to 120%)
- Implemented quality restrictions on U.S. dairy imports
- Accelerated rupee trade settlement mechanisms to bypass dollar dependence
- Increased duties on 28 U.S. product categories including:
Economic Impact Assessment
The cumulative effect of these measures has created complex economic distortions:
- Trade Flow Reorientation:
- U.S.-China bilateral trade declined 14% (2021-2023)
- Vietnam’s exports to U.S. grew 240% as production shifted
- Mexico surpassed China as largest U.S. trading partner in 2023
- Price Effects:
- U.S. import prices rose 6.2% on tariffed goods
- Chinese consumers face 8-12% premium on affected U.S. products
- Global container shipping rates increased 320% (2019-2022)
- Supply Chain Reconfigurations:
- Average multinational corporation now maintains 4.2 supply chain nodes vs 2.8 pre-tariffs
- “China+1” sourcing strategy adopted by 78% of Fortune 500 firms
- Nearshoring investments in Mexico reached $45 billion (2021-2023)
The U.S.-China Trade War: Current Status

Six Years of Economic Confrontation
The U.S.-China trade conflict, initiated under President Trump in 2018 and continued under President Biden, has evolved into one of the most significant economic confrontations of the 21st century. As of 2024, this trade war has fundamentally reshaped global commerce patterns, technological development, and manufacturing ecosystems. What began as a series of tariff escalations has morphed into a comprehensive economic and technological decoupling with profound implications for both nations and the global economy.
Sectoral Impacts and Current Realities
- Technology Sector Transformation:
- Huawei’s Dramatic Decline: Once the world’s second-largest smartphone manufacturer, Huawei’s global market share plummeted from 18% in 2019 to just 4% in 2023 following U.S. sanctions. The company’s revenue fell by 29% in 2021 alone.
- Semiconductor War: U.S. export controls have:
- Blocked Chinese access to advanced chipmaking equipment
- Limited China’s ability to produce semiconductors below 14nm
- Forced Chinese tech firms to rely on legacy 28nm chips
- R&D Consequences: China’s semiconductor self-sufficiency rate has increased from 15% to 26% (2018-2023), but remains far below its 70% target
- Manufacturing Sector Realignment:
- Cost Inflation: U.S. manufacturers report:
- 15-20% higher production costs for consumer electronics
- 12-18% increases in industrial equipment costs
- 25-30% longer lead times for components
- Supply Chain Restructuring: American companies have:
- Reduced direct Chinese sourcing from 40% to 28% of imports (2018-2023)
- Established alternative supply chains in Vietnam, India, and Mexico
- Increased inventory holdings by 35% as buffer against disruptions
- Cost Inflation: U.S. manufacturers report:
- Global Trade Reconfiguration:
- Vietnam’s Emergence: Exports to U.S. grew from 47.7billion(2018)to114 billion (2023), with particular growth in:
- Electronics (58% of total exports)
- Textiles (22%)
- Furniture (12%)
- Mexico’s Advantage: Became top U.S. trading partner in 2023 with $798 billion in bilateral trade
- ASEAN Growth: Southeast Asian nations collectively increased exports to U.S. by 38% (2020-2023)
- Vietnam’s Emergence: Exports to U.S. grew from 47.7billion(2018)to114 billion (2023), with particular growth in:
Educational Consequences
The tariff war has created unexpected challenges for international education:
- Indian Students in U.S.: 20% increase in visa processing times for STEM fields
- Research Collaboration: 35% decline in joint U.S.-China academic papers (2019-2023)
- Technology Access: Engineering students face 30-40% higher costs for specialized equipment
Impact on Indian Markets and Economy

Under Prime Minister Narendra Modi’s flagship “Make in India” program, launched in 2014 to boost domestic manufacturing, the country has experienced both significant opportunities and challenges stemming from evolving U.S. trade policies. The intersection of American protectionist measures and India’s manufacturing ambitions has created a complex economic landscape with measurable impacts across key sectors.
Positive Impacts: Manufacturing Growth and Export Opportunities
- Electronics Manufacturing Revolution
- Apple’s strategic production shift:
- Currently manufactures 7% of global iPhones in India (approximately 14 million units in 2023)
- Expanded operations through Foxconn (Tamil Nadu) and Wistron (Karnataka) facilities
- Plans to increase Indian production to 25% of total iPhones by 2025
- Broader electronics ecosystem development:
- 16 new component manufacturing plants established (2021-2023)
- Mobile phone exports crossed 11billioninFY23(upfrom300 million in FY18)
- Created 120,000 direct jobs in electronics manufacturing
- Apple’s strategic production shift:
- Pharmaceutical Sector Expansion
- U.S. export growth highlights:
- $2.4 billion increase in pharma exports to U.S. (2021-2023)
- 38 new FDA-approved manufacturing facilities added
- India now supplies 40% of generic drugs to U.S. market
- Key growth drivers:
- U.S. diversification away from Chinese API suppliers
- Production Linked Incentive (PLI) scheme for pharma
- Increased compliance with U.S. FDA standards
- U.S. export growth highlights:
- Emerging Sectors Benefiting from Trade Diversification
- Medical devices manufacturing grew by 24% CAGR
- Defense production crossed $1.5 billion in exports
- Electric vehicle components emerging as new growth area
Negative Impacts: Cost Pressures and Supply Chain Challenges
- Renewable Energy Sector Strain
- Solar power industry challenges:
- 18% increase in panel costs due to tariffs on Chinese components
- 12 GW solar projects facing delays due to pricing issues
- Module prices increased from 0.22/wattto0.26/watt
- Domestic manufacturing response:
- PLI scheme allocated $3 billion for solar manufacturing
- Current domestic module capacity: 18 GW (against 30 GW demand)
- Solar power industry challenges:
- Automotive Sector Headwinds
- Input cost pressures:
- 12-15% increase for critical imported components
- ECU prices up by 20-25%
- Semiconductor shortages exacerbated by trade tensions
- Industry adaptation strategies:
- Increased localization from 50% to 65% for many OEMs
- $7.5 billion investment in domestic component parks
- Shift to alternative suppliers in Taiwan and South Korea
- Input cost pressures:
- Engineering Goods and Machinery
- 15-18% cost increase for Chinese-origin machine tools
- 6-8 month delays in capital equipment procurement
- 22% of MSMEs reporting working capital challenges
Policy Responses and Strategic Adaptations
- Government Interventions
- Modified PLI schemes covering 14 key sectors
- 100% FDI permitted in contract manufacturing
- 25% customs duty on 75 imported electronic items
- Industry Initiatives
- Development of 12 champion sectors under industrial policy
- 45 new industrial corridors in development
- 38% increase in R&D spending by Indian manufacturers
- Trade Agreement Developments
- India-U.S. trade grew to $128 billion in 2023
- Ongoing negotiations for comprehensive trade pact
- 200+ U.S. companies actively seeking Indian suppliers
Economic Balancing Act
The “Make in India” program demonstrates both the promise and challenges of navigating global trade realignments:
- Successfully attracted $21 billion FDI in manufacturing (2021-2023)
- Manufacturing GDP share increased from 15% to 18% since 2014
- Yet faces persistent challenges in:
- Competing with Southeast Asian nations on cost
- Developing complete supply chain ecosystems
- Bridging technology gaps in advanced manufacturing
As U.S.-China trade tensions persist, India’s ability to leverage its demographic dividend, improving infrastructure, and policy incentives will determine whether it can fully capitalize on this unique opportunity to establish itself as a global manufacturing alternative to China.
Socioeconomic Impacts on Citizens
In India:
- Consumer electronics prices rose 8-12%
- Textile sector added 400,000 new jobs (2022-2023)
- RBI Governor Shaktikanta Das maintains cautious inflation targeting at 4-6%
In United States:
- Average family pays $1,200 more annually due to tariffs (Tax Foundation)
- Midwest farmers received $28 billion in trade war bailouts (2018-2020)
Macroeconomic Implications
For India:
- GDP growth projection revised to 6.3% (RBI, 2023)
- Forex reserves at $600 billion provide stability buffer
- Manufacturing PMI consistently above 55 since 2021
For United States:
- Inflation remains sticky at 3.7% (Sept 2023)
- Trade deficit with China shrank by $80 billion (2021-2023)
Conclusion: Navigating the New Trade Normal
The Biden administration’s tariff policies continue to reshape global commerce, creating both challenges and opportunities. For PM Modi’s India, this represents a critical juncture to:
- Capitalize on supply chain diversification
- Manage inflationary pressures through prudent RBI policies
- Strengthen domestic manufacturing capabilities
As both nations approach important electoral cycles in 2024, these trade policies will remain central to economic debates, with lasting implications for global economic stability and growth.